Let’s get this straight: comparing bitcoin and gold in terms of pure performance makes little sense: it’s like comparing a race car designed to reach extreme speeds with one designed to last for decades without breaking down. Bitcoin was born as a speculative and highly volatile asset, while gold has historically been a stable store of value. Their functions in an investor’s portfolio are profoundly different.
However, this does not prevent us from comparing them directly to extrapolate interesting concepts, such as risk perception, trust in the economic system or reactions to crisis scenarios.
I am not a financial advisor:
The information provided does not constitute a solicitation for the placement of personal savings. The use of the data and information contained as support for personal investment operations is at the complete risk of the reader.
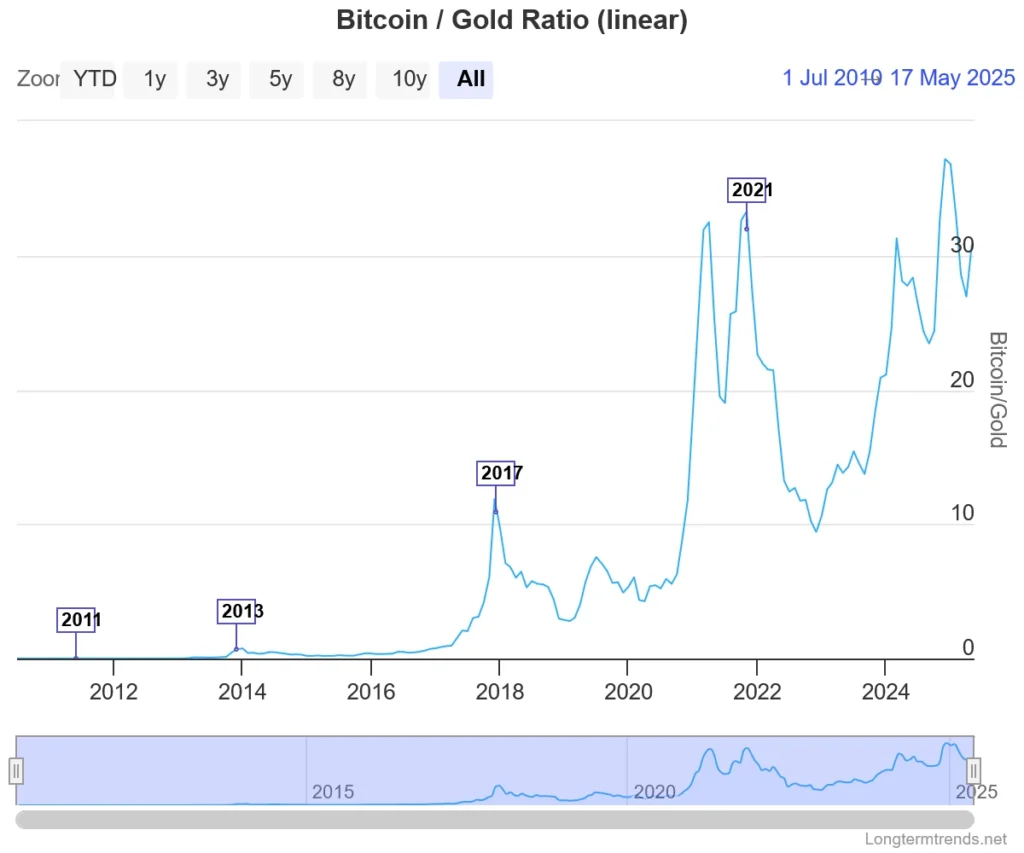
The bitcoin/gold price ratio indicates how many ounces of gold it takes to buy a single bitcoin. In other words, it measures the relative value of bitcoin and gold. A high ratio means that bitcoin is worth much more than gold, while a low ratio indicates the opposite. This indicator helps compare the two assets by showing how the strength of one relative to the other changes over time.
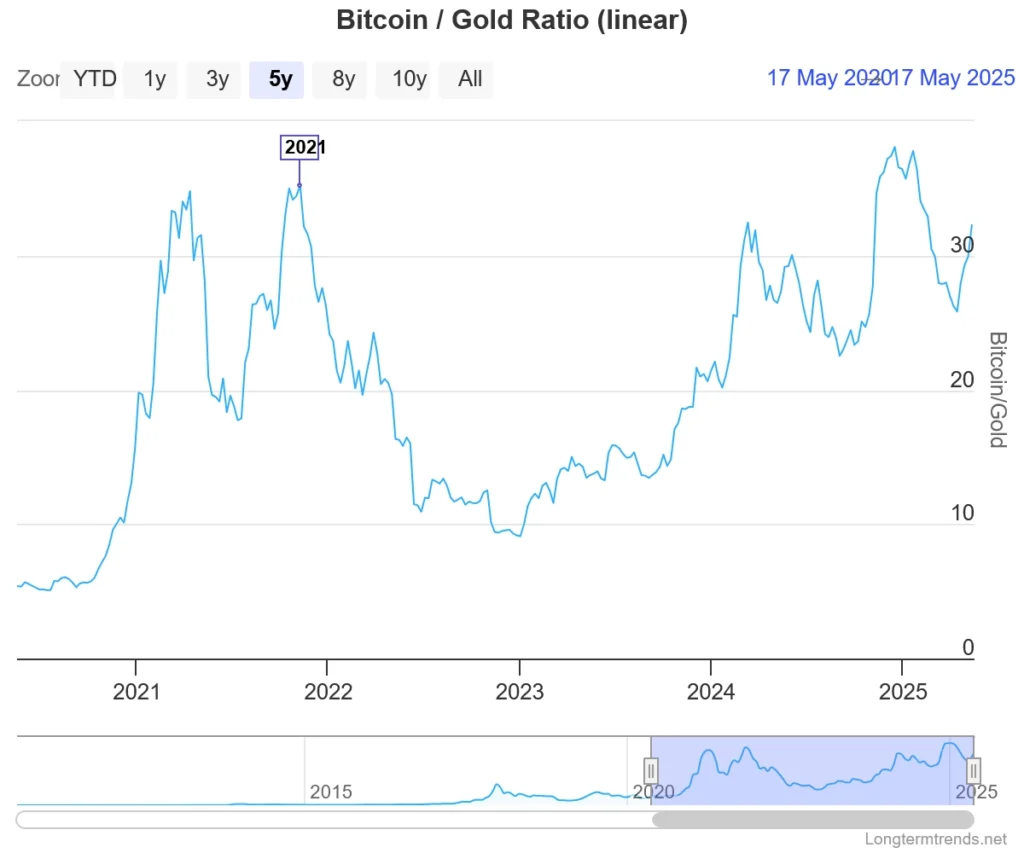
Since 2011, bitcoin has gained a lot of value against gold, especially in 2017 and 2020. (longtermtrends.net)In the last 5 years, bitcoin has practically never surpassed the previous highs against gold. (longtermtrends.net)
From 2011 to 2025, the ratio of Bitcoin to gold has shown strong fluctuations, reflecting the volatility of Bitcoin compared to the stability of gold. The main peaks occurred in 2017, 2021 and early 2024, exceeding the ratio of 30 in the last two cases. After each peak, strong declines followed, indicating intense speculative cycles. Since 2023, the trend appears to be growing again, albeit with greater instability. Overall, the value of bitcoin against gold has increased dramatically compared to the early years.
From 2020 to 2025, however, the bitcoin/gold ratio showed strong fluctuations. After a rapid surge in 2021, which marked a high above 35, the ratio collapsed in 2022, reflecting a bearish phase of Bitcoin. Between the end of 2022 and the beginning of 2024, a slow recovery was observed, culminating in a new peak above 35. However, this peak was also followed by a new decline. The trend confirms the high volatility of bitcoin compared to gold, which however in these last 5 years does not seem to want to give the same performance as in the past.
Bitcoin/Gold price correlation
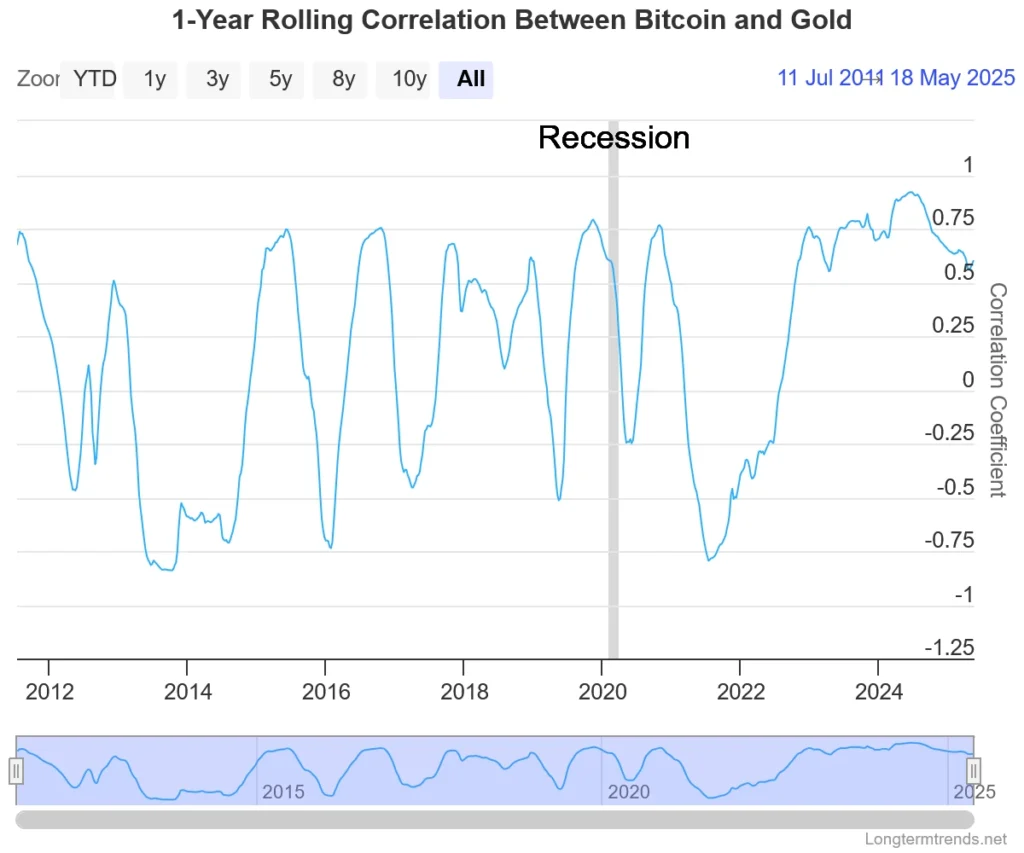
Correlation indicates how much two assets move together, with values ranging from +1 (perfectly parallel movement) to -1 (perfectly opposite movement), while 0 indicates no relationship. In the case of bitcoin and gold, a positive correlation means they tend to rise or fall together, while a negative correlation suggests that when one goes up, the other goes down.
Almost predictable correlation of bitcoin and gold prices since 2012. (longtermtrends.net)
From 2012 to 2025, the one-year correlation between Bitcoin and gold has frequently oscillated between positive and negative values, drawing a pattern that appears almost sinusoidal. These cycles, although visually regular, do not follow a perfect periodicity and are sometimes interrupted by sudden and decisive movements. Starting in 2022, the link between bitcoin and gold has strengthened positively in an anomalous way, reaching very high and stable levels around 0.75 until recently.
In recent weeks, an inversion has been observed: the curve has started to bend downwards, suggesting the beginning of a new cycle. If past behavior repeats itself, it is plausible to expect a rapid decline towards negative values. This would mean that gold and bitcoin could start to move in opposite directions. Historically, when correlation drops, bitcoin is often the one to undergo marked corrections, while gold tends to maintain its trajectory.
Overall, the correlation between bitcoin and gold, while sometimes showing phases that appear to follow a predictable pattern, appears to be substantially neutral in the long term, with phases of positive correlation that tend to balance, or cancel, the negative ones.


Leave a Reply