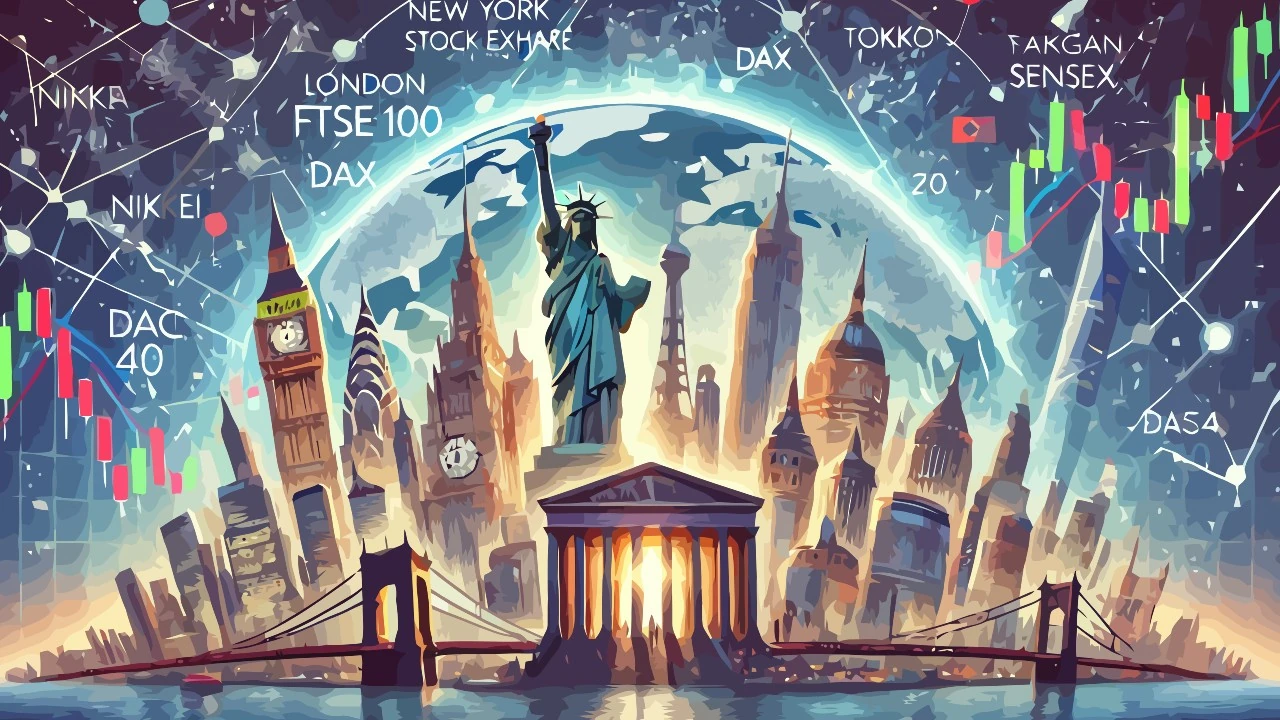
World market indices reflect the performance of global economies, highlighting growth dynamics and the main driving sectors. Each geographical area contributes to outlining financial trends, from developed to emerging markets.
These tools guide investors’ decisions and provide a comprehensive view of global economic movements.
The North American market is the world’s largest market capitalization, dominated by the United States and Canada. The indices reflect a strong presence of technology, financial and industrial sectors, with Wall Street as the global nerve center.
Country
Index
Components
Year of creation
Description
USA
S&P 500
500
1957
Includes the 500 largest U.S. corporations
USA
Dow Jones Industrial
30
1896
30 Largest US Companies
USA
NASDAQ Composite
3.000
1971
NASDAQ-listed technology stocks
USA
NASDAQ-100
100
1985
NASDAQ 100 Largest Non-Financial Companies
USA
Russell 2000
2.000
1984
2,000 US Small Cap Companies
USA
S&P MidCap 400
400
1991
US mid-cap companies
USA
Wilshire 5000
5,000
1974
All stocks listed on the US market
Canada
S&P/TSX Composite
250
1977
Main index of the Toronto Stock Exchange
#2. Europe indices
European markets are characterized by a combination of mature economies and highly regulated markets. Indices such as the DAX, FTSE 100 and CAC 40 represent the major European stock exchanges and key sectors such as energy, financials and consumer goods.
Country
Index
Components
Year of creation
Description
United Kingdom
FTSE 100
100
1984
100 Most Capitalized UK Companies
United Kingdom
FTSE 250
250
1992
UK Mid-Cap Companies
Germany
DAX 40
40
1988
40 Major German Companies
France
CAC 40
40
1987
40 major French companies
Eurozone
EURO STOXX 50
50
1998
Top 50 Eurozone Companies
Italy
FTSE MIB
40
1997
40 most capitalized Italian companies
Spain
IBEX 35
35
1992
35 Major Spanish Companies
Netherlands
AEX
25
1983
Major Dutch companies
Sweden
OMX Stockholm 30
30
1986
30 largest Swedish companies
#3. Asia-Pacific indices
The Asia-Pacific region is home to dynamic and rapidly growing economies, including Japan, China, and India. Major indices, such as the Nikkei and Hang Seng, reflect the region’s industrial might and technological innovation.
Country
Index
Components
Year of creation
Description
Japan
Nikkei 225
225
1950
225 Leading Companies in Japan
Japan
TOPIX
2.000
1969
Tokyo Stock Exchange First Section Company
Hong Kong
Hang Seng Index
50
1969
Top Hong Kong Companies
China
Shanghai Composite
1,500
1991
Main index of the Shanghai Stock Exchange
South Korea
KOSPI
800
1983
Major South Korean companies
Australia
S&P/ASX 200
200
2000
200 Largest Australian Companies
India
Nifty50
50
1996
50 Most Capitalized Companies in India
India
BSE Sensex
30
1986
Top 30 Companies of Bombay Stock Exchange
#4. Latin America indices
Latin American markets are heavily influenced by the commodity, energy and agriculture sectors. Indices such as Bovespa and MERVAL reflect the volatility and growth potential of emerging economies.
Country
Index
Components
Year of creation
Description
Brazil
Bovespa
80
1968
Main index of the Sao Paulo Stock Exchange
Mexico
IPC Mexico
35
1978
Main index of the Mexican Stock Exchange
Argentina
MERVAL
20
1986
Main index of the Buenos Aires Stock Exchange
#5. Middle East indices
Middle Eastern markets are dominated by the energy and financial sectors, with a strong influence from oil. Indices such as the Saudi Tadawul show the expansion of local markets and the growing openness to foreign investors.
Country
Index
Components
Year of creation
Description
Saudi Arabia
Tadawul All Share
200
1985
Main index of the Saudi Stock Exchange
Israel
Tel Aviv 35
35
1992
35 Most Capitalized Israeli Companies
United Arab Emirates
DFM General Index
65
2000
Dubai Stock Exchange Index
#6. Africa indices
African markets, while less developed, offer opportunities in sectors such as natural resources and infrastructure. The South African FTSE/JSE Top 40 is the continent’s most representative index.
Country
Index
Components
Year of creation
Description
South Africa
FTSE/JSE Top 40
40
2002
Top 40 South African Companies
Egypt
EGX 30
30
2009
Main index of the Egyptian Stock Exchange, includes the 30 most liquid and capitalized companies of the Egyptian market.
Morocco
MASI (Moroccan All Shares Index)
75
2002
Index that replicates the performance of all companies listed on the Casablanca Stock Exchange, offering a complete overview of the Moroccan market.
#7. Global indices
Global indices such as MSCI World and FTSE All-World provide a diversified view of world markets, combining developed and emerging economies. These instruments are often used for global investment strategies.
Country
Index
Components
Year of creation
Description
Global
MSCI World Index
1,500
1969
Stocks from 23 developed countries
Global
MSCI Emerging Markets
1.400
1988
Represents emerging markets
Global
MSCI ACWI
3.000
1988
Includes developed and emerging markets
Global
FTSE All World
4,000
1986
Companies from over 49 developed and emerging countries


Leave a Reply