We relate the price of gold, silver and the S&P500 to the amount of the M1 money supply of the United States of America since 1960. We then deduce whether the various equated goods are undervalued or overvalued in relation to the current reference money supply.
Disclaimer:
The information provided does not constitute a solicitation for the placement of personal savings. The use of the data and information contained as support for personal investment operations is at the complete risk of the reader.
The money supply represents the total amount of money available in an economy and is divided into different categories depending on the level of liquidity. These categories, called M0, M1, M2 and M3 , are used to measure the amount of money in circulation and its immediate accessibility.
M0: Includes cash in circulation and reserves held at the central bank. It is the monetary base and represents the most liquid form of money.
M1: Includes M0 plus demand deposits, i.e. funds immediately available in current accounts and savings books.
M2: Contains M1 plus short-term deposits, such as savings accounts and certificates of deposit with short maturities.
M3: Includes M2 plus less liquid financial instruments, such as short-term bonds and money market funds.
M1 is essential to understanding the immediate liquidity of an economy, as it measures the amount of money immediately available for transactions and payments. An increase in M1 indicates a greater availability of liquid money, often related to consumption and inflation. Conversely, a contraction can signal economic distress or a credit crunch. Monitoring M1 therefore helps to assess the dynamism of the economy and consumer behavior.
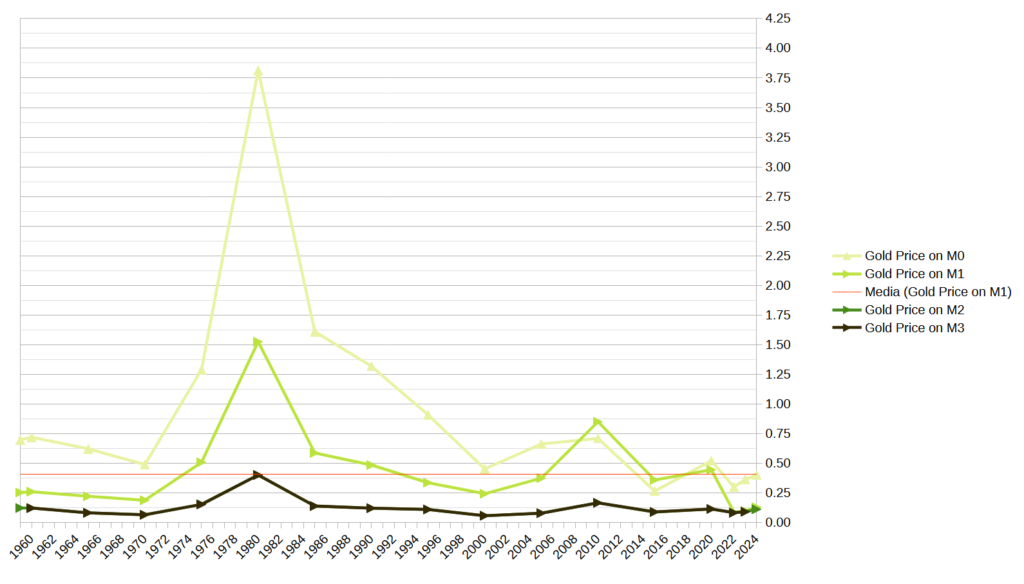
Below you will find the spreadsheet I created to calculate the value of the ratio of the various traded goods to the M1 money supply.
#2. Ratios on M1 money supply
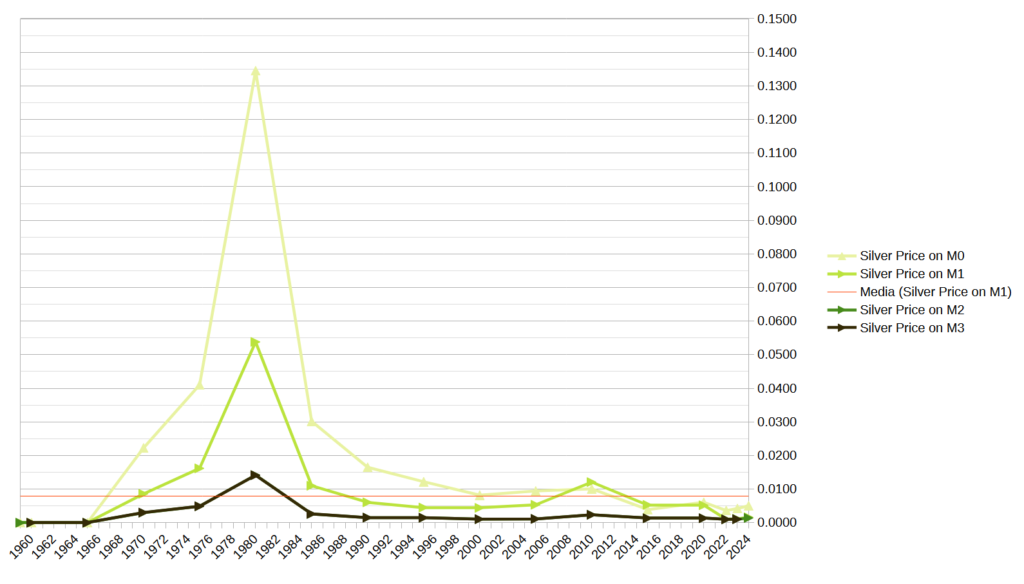
Gold to M1 ratio.Silver to M1 ratio.S&P 500 report on M1.
From the graphs shown, we can therefore deduce the following:
Gold on M1: Widely undervalued compared to the average value.
Silver on M1: Extremely undervalued compared to the average value.
S&P 500 on M1: quite undervalued compared to the average value.
The average value of the ratio of various goods to M1 is represented by the red line.


Leave a Reply