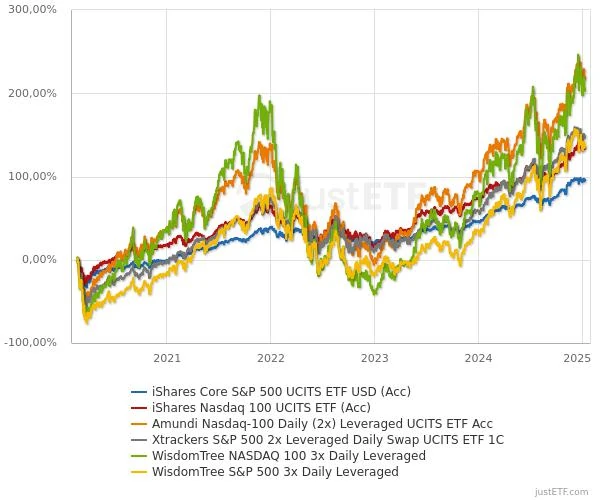
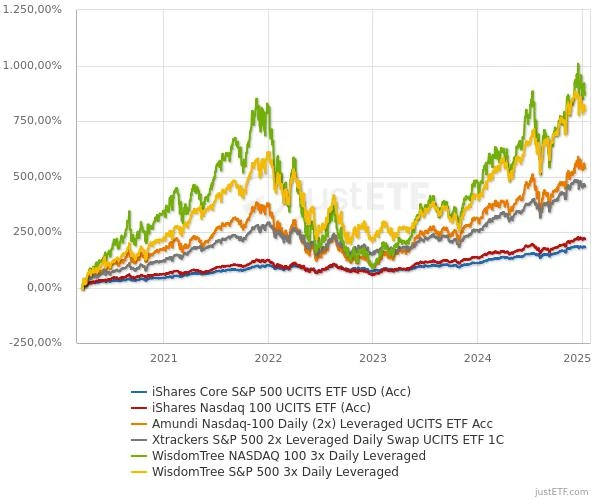
Let’s compare the returns of the best performing leveraged and non-leveraged stock indices of all time in order to draw conclusions on which might be the most convenient method to invest in them.
The oldest available data for the funds is from the end of 2015. A 10-year time span is not the best, but I believe it is sufficient to support my final conclusions.
Disclaimer:
The information provided does not constitute a solicitation for the placement of personal savings. The use of the data and information contained as support for personal investment operations is at the complete risk of the reader.
Comparing returns starting from the most relevant 3 previous highs reached, we note that the 2x leveraged indices of the S&P 500 have had the best performance.
The fact that, in this context, a leveraged index performs better than the unleveraged one is possible if one is patient enough to wait for the next bull cycle and lucky enough for that cycle to perform sufficiently better than the previous one.
In fact, the leveraged Nasdaq 100 underperformed in 2 of the 3 scenarios reported.
Pre-Covid (18 Feb 2020)Pre-market bubble (19 Nov 2021)Pre-correction (10 Jul 2024)
Period
S&P 500 unlever.
S&P 500 2x lever.
S&P 500 3x lever.
Nasd. 100 unlever.
Nasd. 100 2x lever.
Nasd. 100 3x lever.
Pre-Covid (18 Feb ’20)
+96%
+147%
+136%
+134%
+218%
+203%
Pre-market bubble (19 Nov ’21)
+43%
+47%
+33%
+41%
+31%
+2%
Pre-correction (10 Jul ’24)
+11%
+12%
+12%
+8%
+5%
-1%
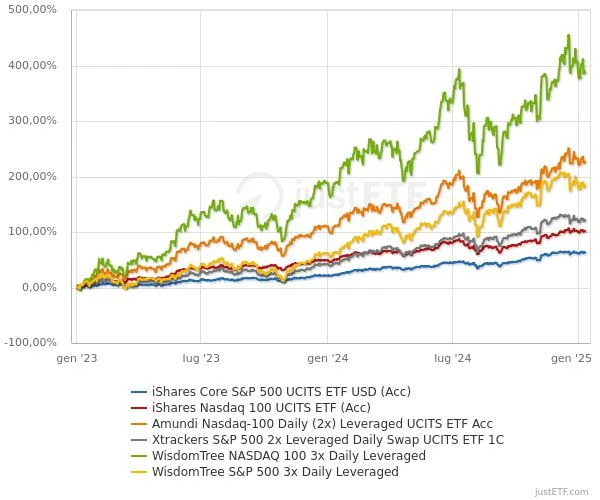
#3. Returns from last lows
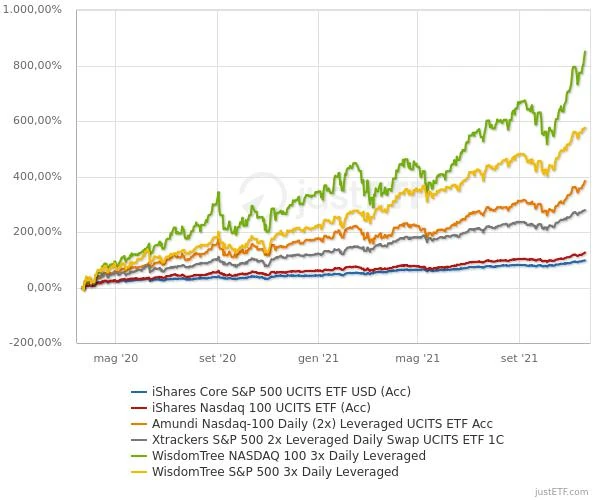
Comparing returns starting from the most relevant 3 previous lows reached, we note that the 3x leveraged indices have performed best.
This is quite normal as buying on leverage before an uptrend carries a significant edge in profits.
Covid (21 Mar 2020)Post-market bubble (01 Jan 2023)Post-correction (07 Aug 2024)
Period
S&P 500 unlever.
S&P 500 2x lever.
S&P 500 3x lever.
Nasd. 100 unlever.
Nasd. 100 2x lever.
Nasd. 100 3x lever.
Covid (21 Mar ’20)
+183%
+458%
+802%
+219%
+538%
+870%
Pre-market bubble (01 Jan ’23)
+63%
+120%
+183%
+101%
+225%
+386%
Post-correction (07 Aug ’24)
+21%
+34%
+46%
+26%
+43%
+59%
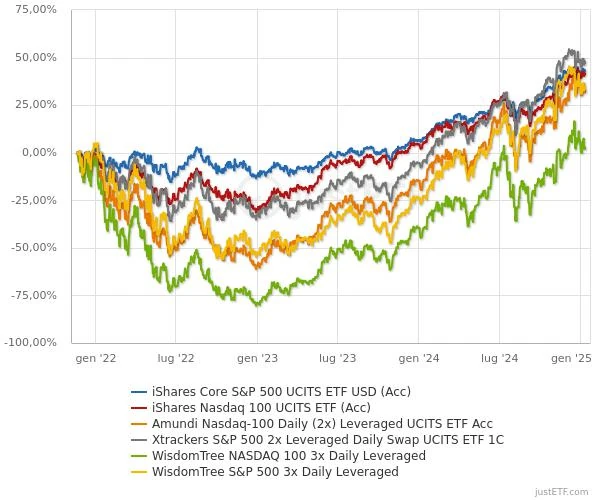
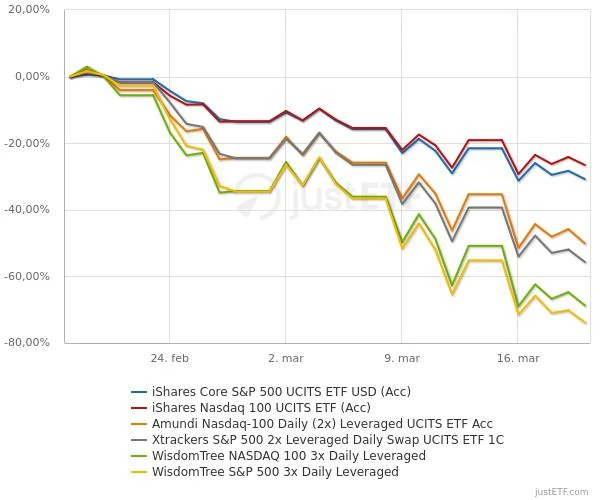
#4. Worst times to trade
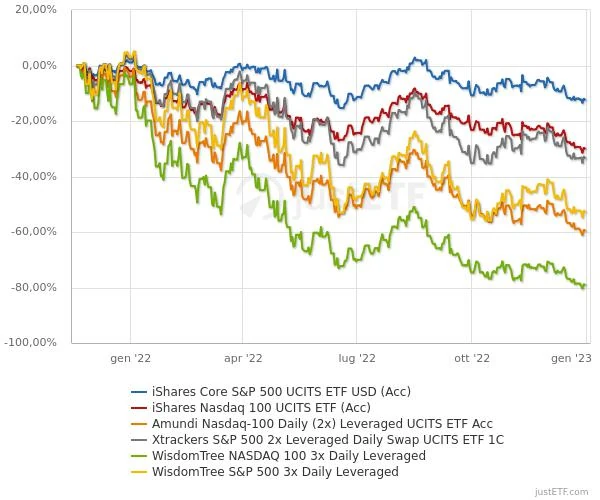
Comparing returns before a significant retracement, we note that leveraged indices have recorded the greatest losses, with lows reaching -80%.
You have to be very unlucky to invest large amounts before a significant retracement, but you can easily avoid this unpleasant event by investing small, unleveraged amounts when rising values surpass previous highs.
From 18 Feb 2020 to 21 Mar 2020From 19 Nov 2021 to 01 Jan 2023
Period
S&P 500 unlever.
S&P 500 2x lever.
S&P 500 3x lever.
Nasd. 100 unlever.
Nasd. 100 2x lever.
Nasd. 100 3x lever.
18 Feb ’20 21 Mar ’20
-30%
-56%
-74%
-26%
-50%
-69%
19 Nov ’21 01 Jan ’23
-12%
-33%
-53%
-30%
-59%
-79%
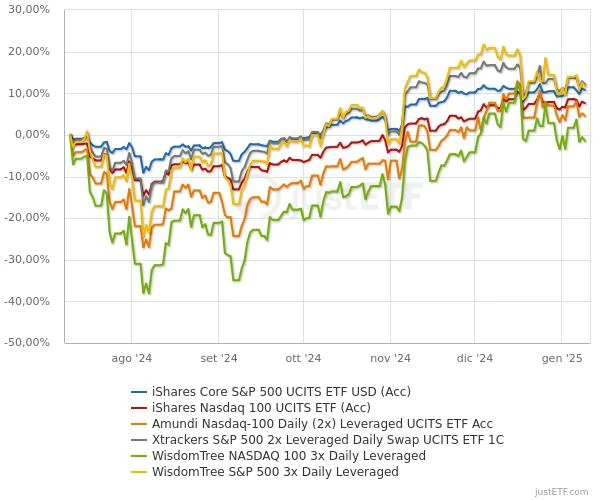
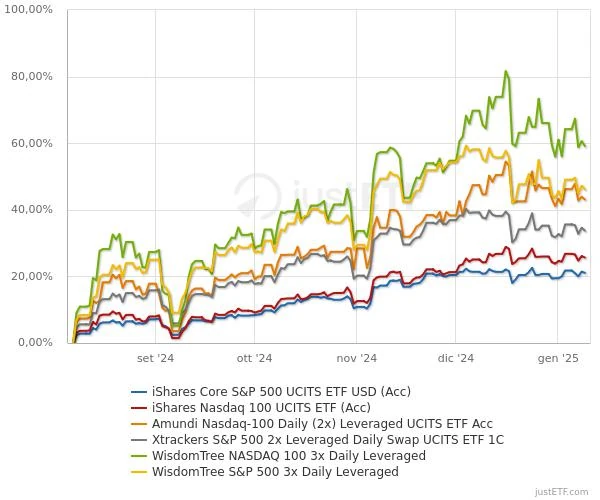
#5. Best times to trade
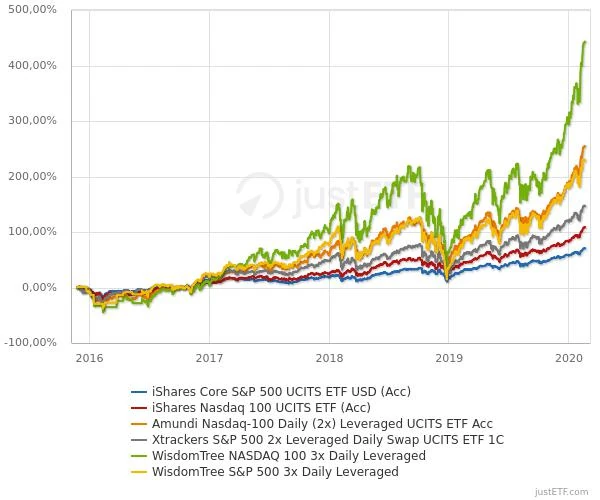
Comparing the returns before a bullish period, we see profits that, with the most leveraged indices, can reach an appreciation of the invested capital of almost 10 times!
However, you have to be incredibly lucky to buy large amounts of leverage at the right time. I would not recommend this to anyone as it is very difficult to predict market lows (as well as highs, for that matter).
From 24 Nov 2015 to 18 Feb 2020From 21 Mar 2020 to 19 Nov 2021From 01 Jan 2023 to 09 Jan 2025
Period
S&P 500 unlever.
S&P 500 2x lever.
S&P 500 3x lever.
Nasd. 100 unlever.
Nasd. 100 2x lever.
Nasd. 100 3x lever.
24 Nov ’15 18 Feb ’20
+70%
+146%
+228%
+228%
+254%
+443%
21 Mar ’20 19 Nov ’21
+98%
+279%
+576%
+126%
+384%
+850%
01 Jan ’23 09 Jan ’25
+63%
+121%
+183%
+102%
+225%
+387%
#6. Summary analysis
Analyzing the data extracted from the ETFs that are the subject of this comparison, I can conclude that investing with leverage in performing stock indices is safer than investing with leverage in gold . In fact, even buying at the highest levels, it is always possible (within the limits of the available data) to recover the losses if you are patient enough.
However, recovering losses should not be confused with making good profits. Only by buying leveraged in the early stages of a bull cycle can you achieve stratospheric returns compared to unleveraged indices.
Furthermore, if you buy with leverage, you must be prepared to endure temporary losses that can reach -80%!


Leave a Reply